Shareholder - Integrated ownership
Corporate structures might be very intricate. In many instances, they involve indirect ownership and self-ownership. As well as the traditional approach to ownership, a new method to delve into this complexity and instantly spot each entity’s accumulated stake has been created. Based on Moody's ownership data, T-rank uses a unique set of algorithms and software capabilities to compute integrated percentages.
An integrated percentage is a ‘calculated’ ownership percentage corresponding to the computation of all direct links and all indirect links of one entity into another.
Integrated ownership reveals who ultimately owns a company, regardless of number of ownership levels, cross- and circular ownership.
Integrated ownership is available in 1) Shareholders by T-rank, 2) The T-rank module and 3) Ownership explorer.
Simple integrated ownership
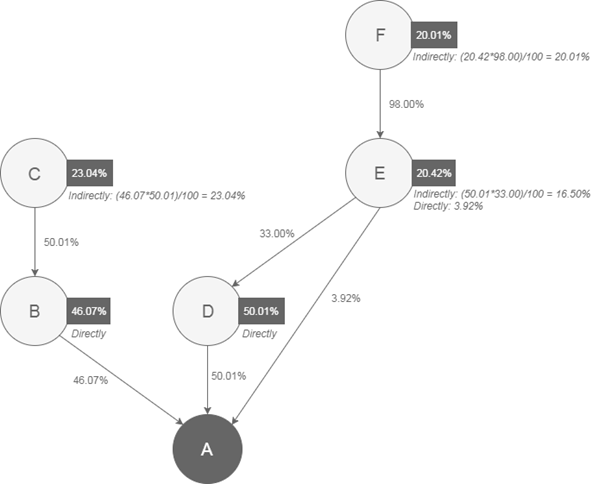
This first example shows the general method of computation. The integrated percentage of each entity into the subject Company A is displayed in the box attached to each node. Details on the computation are displayed below each entity’s integrated percentage.
Integrated ownership in structures with circular ownership
Circular ownership results in a company owning (directly or indirectly) a share of itself. When someone owns a share of a company, they also own a corresponding share of the ownership the company directly or indirectly has in itself.
However, since the other shareholders are the only owning stakeholders in the company, they also indirectly owns the shares owned by the company itself. When it comes to integrated ownership, these shares are divided pro-rata amongst the other shareholders.
In Figure 3, B owns 80% of C, the last 20% is owned by C itself. Since B is the only direct owner in C, besides C itself, B also indirectly owns these shares – B’s integrated ownership in C is 100%.
A’s integrated ownership in C becomes 40% × 100% = 40%.
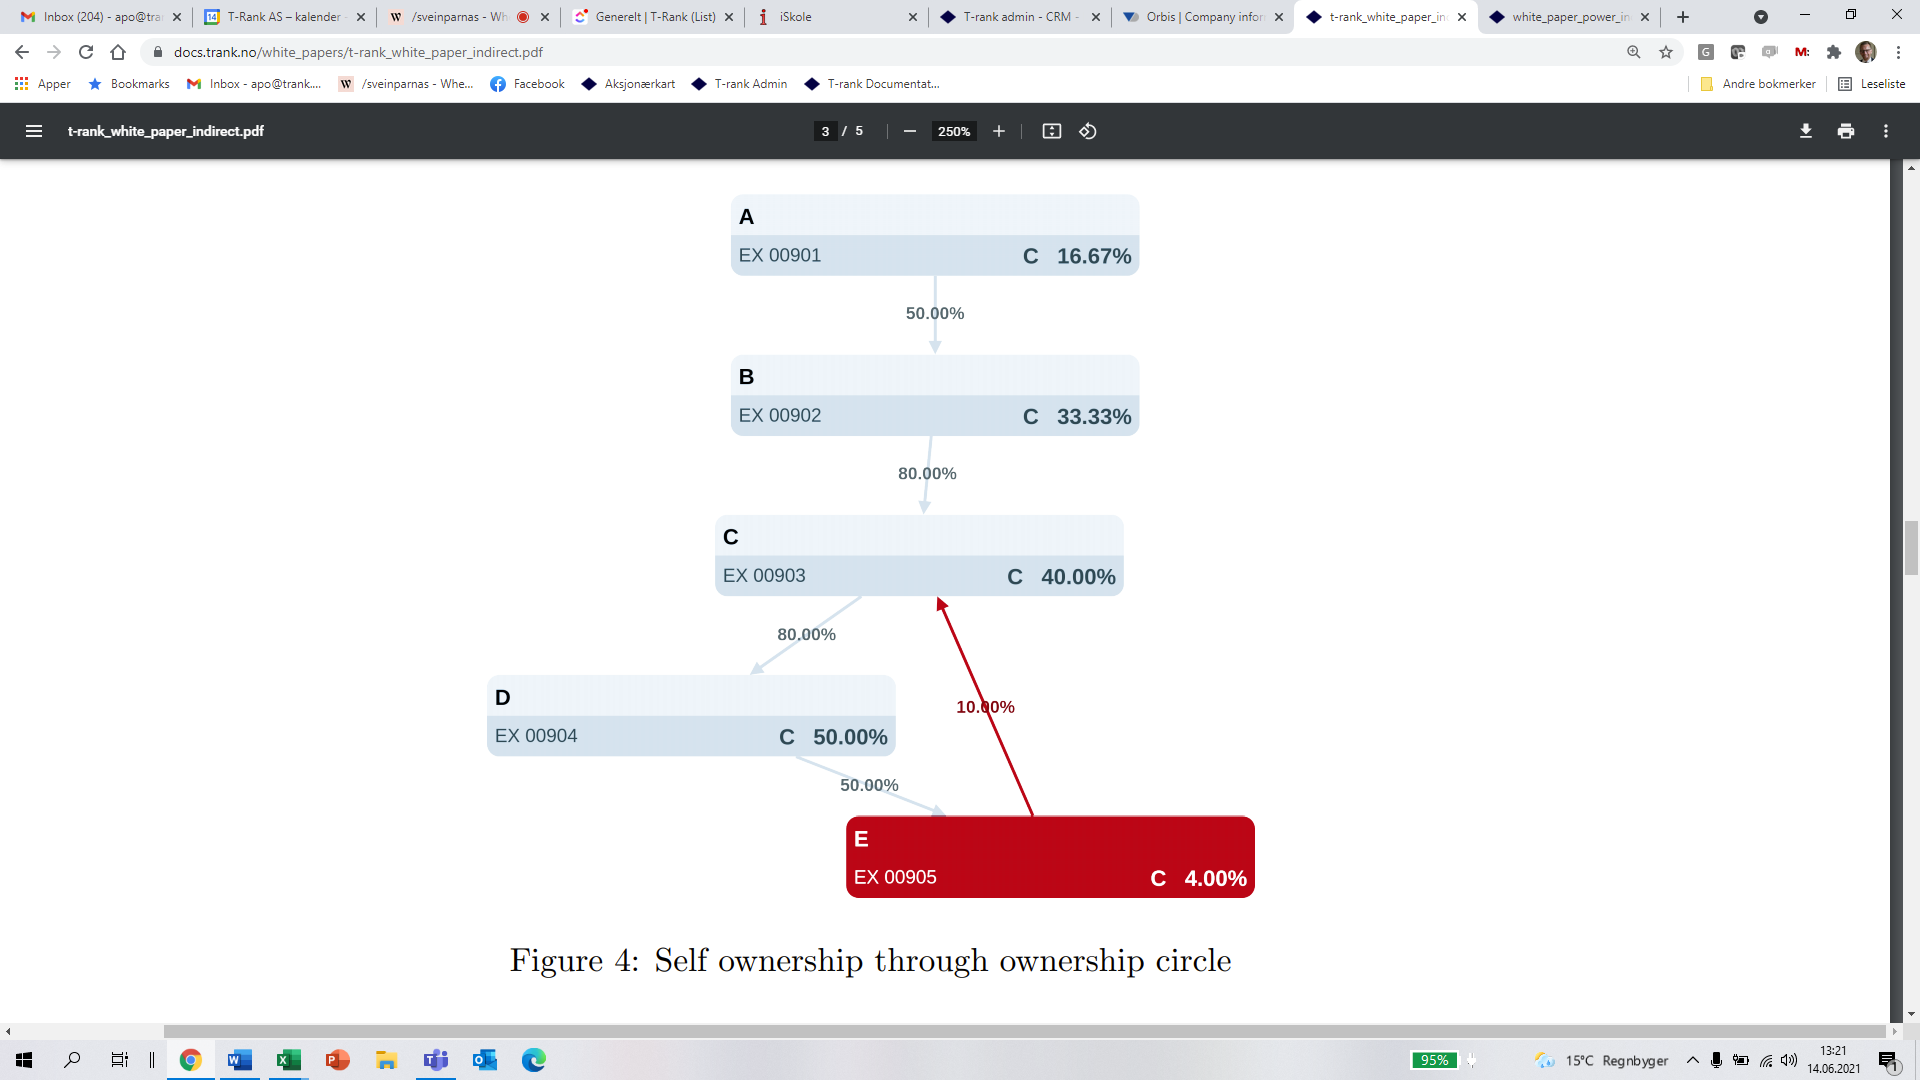
In Figure 4, C’s indirect ownership in itself is found by tracing the circular ownership loop
C → D → E → C : 80% × 50% × 10% = 4%. C’s indirect ownership in itself must be taken into account when calculating B’s integrated ownership in C: 80%/(100% − 4%) = 80%/96% = 83.33%. Then we find that A’s integrated ownership in C becomes 50% × 83.33% = 41.67%.
Integrated ownership in Shareholders by T-rank
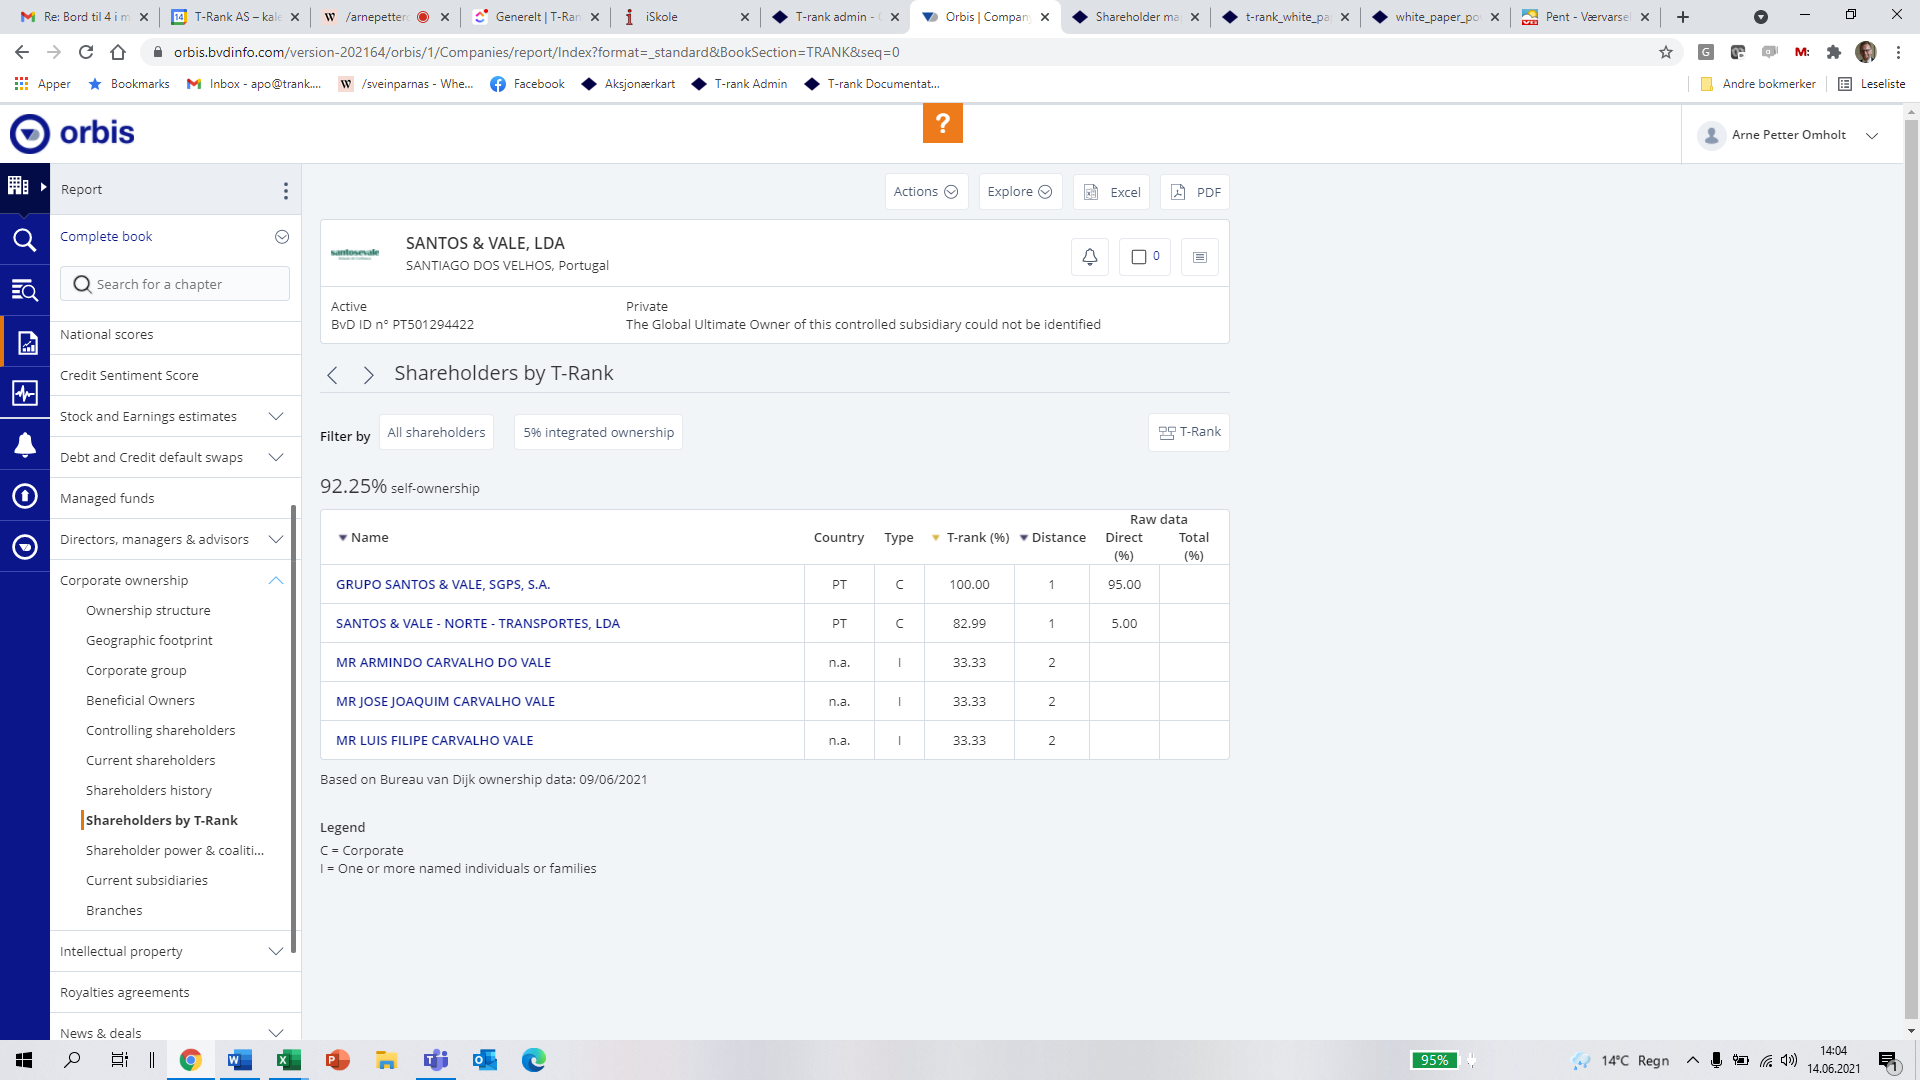
Integrated ownership is available in the chapter «Shareholders by T-rank» under «Corporate ownership» in Orbis.
The screenshot below shows an example:
The table displays the shareholders ranked based on integrated ownership. The column «T-rank (%)» contains integrated ownership.
Integrated ownership in Shareholder maps
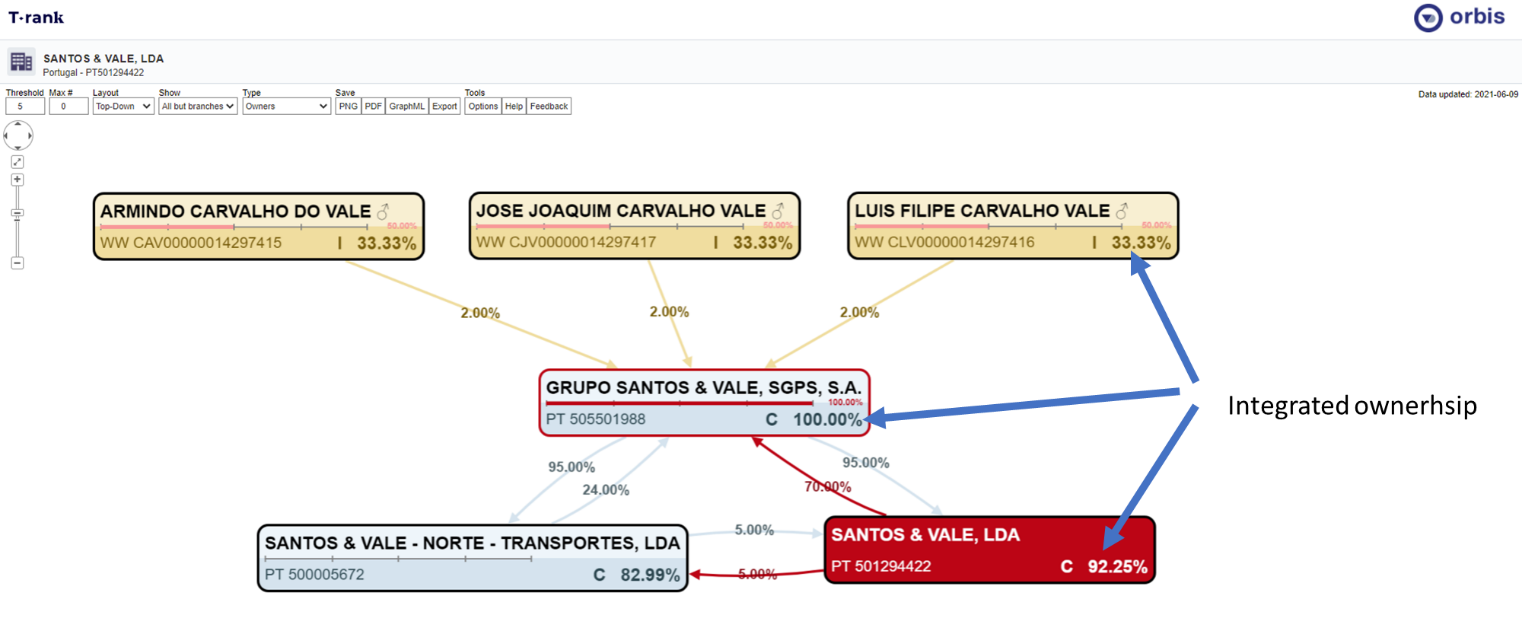
Shareholder Maps is available via the T-rank button under Shareholders by T-rank, the T-rank button under «Shareholder power & coalitions» and the T-rank button under «Explore»-menu on the top of the pages.
Saving and exporting Shareholder maps
Best practice is to edit the shareholder structure until you are satisfied before saving or exporting the results. Options to do this can be found under Save at the top of the page:
PNG
Files in this popular image format can be viewed in a browser, and inserted into any kind of document (such as Word or PowerPoint). PNG has some advantages over PDF: it is easier to resize a PNG image than a PDF document, and it will have higher quality at a lower file size. Especially for large maps, quality may become too low on PDF exports.
Selecting PNG displays the following pop-up:
Complete map
Save the complete structure you are looking at.As seen on screen
Save the exact picture you are looking at. The difference from Complete map is related to zooming: if you zoom in on just a small part of a shareholder structure, you can use this option to save that part only.Quality
Options Low, Normal, High, and Very high offer a choice between economy of file size or clarity of image (recommended for larger structures).Copy to clipboard
Use if you want to paste the structure into another document.Download
Use if you want to save the structure to a file.
Select this option and the complete map you are looking at will be downloaded as a document in PDF format.
GraphML
Select this option and the shareholder structure will be downloaded as a file in the GraphML format, which is an XML-based file format for graphs, which is further explained here: https://en.wikipedia.org/wiki/GraphML
Export
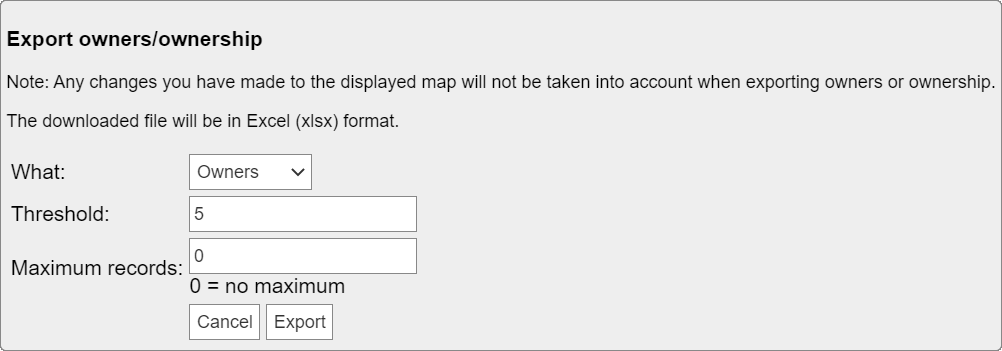
Use when you want to save all the underlying shareholder data that matches the selection criteria as a file in Excel format. This option will not take into account any changes you have made to the map.
Selecting Export displays the following pop-up:
What
Select owners or subsidiaries as required.Threshold
This is related to integrated ownership. For example, if the threshold is 5, you will only get data for shareholders with an integrated ownership above 5%.Maximum records
The maximum number of rows in the Excel worksheet.Export
Click to download the resulting Excel worksheet, like the following example.
